Four things to know about the 2020 life expectancy drop.
And yes, it’s worse than even the headlines are letting on.
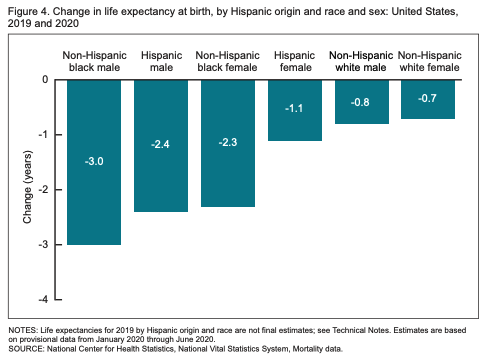
We now have hard statistical evidence to substantiate something we all kind of knew already: 2020 was the worst year in living memory. The CDC calculated life expectancy for the first half of 2020 and found that US life expectancy, overall, fell by a year (from 78 to 77 years) and dropped two to three times more years among brown and Black Americans.
These numbers are staggering unto themselves. But let’s put some context around them. This is the biggest drop in life expectancy in a single period since World War II. In fact, 2020 erased 14 years in life expectancy growth, taking us back to 2006 numbers on average. Worse, differences in Black-white life expectancy have been falling since the beginning of the last century. This is the first time they’ve widened, taking us back to differences we hadn’t seen since 1998!
I want to unpack these numbers—to illustrate for you why this drop is unprecedented. Let’s start with what life expectancy means in the first place.
Life expectancy is an average not a destination.
The term “life expectancy” is a bit of a misnomer. It’s not really an estimate of how much “life” one can “expect.” Rather, life expectancy approximates the average age at death in a particular place in a given time.
When you hear figures like “the life expectancy in the Democratic Republic of Congo is 60,” you’re tempted to think that people slump over at their 60th birthday party. That’s not quite how things work. Instead, that number tends to be driven by early deaths—particularly among children and young or middle-aged adults. If you think about it, an early death—say at one year of age—contributes WAY more to reducing the life expectancy than a later death. With a single baby’s passing, we lose with her 78 years from our collective pool of total years lived—which would be functionally equivalent to 78 people dying a year earlier.
Because life expectancy is an average of the entire population, it also tends to bury vast differences in the probability of earlier death among different demographic and geographic subgroups—and the ways that premature death among those groups change the overall averages.
As we think about the impact of 2020 on life expectancy we should keep one question at the front of our minds: “Who was dying earlier than they should have?” Taking the blade of this question to the numbers will help us unpack what happened in 2020 and what it might mean for the future. Here are four takeaways:
1. People who died of COVID-19 weren’t “going to die anyway.”
As the virus ripped through long-term care homes and hospitalized millions—particularly seniors and people with pre-existing conditions—there was a notion that the people COVID-19 was killing were already on death’s door. The narrative that it was only affecting the old and the sick—people more likely to die in the first place—was implicit in the politicization of the pandemic, right along with the idea that COVID-19 was nothing serious, “just a flu.”
The reality: By the end of the first half of 2020, nearly 127,000 Americans had died of COVID-19. One group of demographers calculated that the average person who died of COVID-19 lost 11.7 additional years of life. Twenty percent—a full one in five of those who’ve died of COVID-19—were under 65. That jumps to nearly one in three among people of color! Which brings us to the second takeaway...
2. People of color are dying younger than white people.
As we discussed, examining average life expectancy tends to bury critical demographic and geographic differences in the data. Though the average decline in life expectancy overall was about a year in 2020, the decline was three years more among Black men, and between two and three years overall among Black and Latinx Americans.
Remember, life expectancy reflects who dies earlier than they should have. And evidence through the first half of 2020 shows that Black and Latinx people who died of COVID-19 were 2.5 times as likely to be under 65 compared to white people who died. So it’s not just that Black and brown people were substantially more likely to die—but that they were likely to die earlier than whites. The average Black or brown American who died lost more years of their life than the average white American who died.
3. It was the pandemic, not just the virus.
Many of the people who’ve died because of COVID-19 didn’t die of SARS-CoV-2 but died because of the circumstances the pandemic created. Think about that person with heart disease who lost her insurance and had to put off medical care until it was too late or the one who turned back to opioids after he lost his job.
Recent evidence suggests that this accounts for nearly a third of the extra deaths that led to this drop in life expectancy. A study by researchers at Virginia Commonwealth University used data about past mortality to calculate how many deaths we should have expected between March and August 2020 if the pandemic had never happened. By comparing that to the number of deaths we actually observed, they were able to calculate the number of “excess deaths” attributable to the pandemic. But here’s the most important part: they compared the number of excess deaths to the numbers of deaths in which there was a COVID-19 diagnosis. They found that COVID-19 itself was only implicated in about two in three deaths.
And there’s some context you need to understand, between 2016-2018 life expectancy had already fallen for three straight years. Why? So-called “deaths of despair”—alcohol, drug overdose, and suicide among, primarily, middle-aged non-college-educated rural white people.
Of relevance to our conversation about the gargantuan drop in life expectancy in 2020 is how the pandemic accelerated these trends. The answer should be obvious: millions lost their jobs and more were cut off from their support systems by the pandemic. Experts are predicting that 2020 may be the deadliest date on record for opioid deaths and evidence suggests that deaths by suicide may be on the rise.
4. The next round of life expectancy numbers will probably be worse
These life expectancy numbers only cover the first half of 2020—from January 1 to July 1. And as staggering as they may be, the second half of 2020 is probably going to be worse. There are three reasons why.
First, the first recorded death to COVID-19 didn’t happen until the end of February (though good evidence suggests deaths had occurred earlier)—meaning the impact of the pandemic on the life expectancy numbers for the first half of 2020 didn’t really get going until a third of the way through the period being analyzed.
Second, more people died in the second half of 2020 than did in the first. Compared to the 127,000 deaths before July 1, there were nearly 230,000 between then and the end of the year, the majority coming during the fall spike.
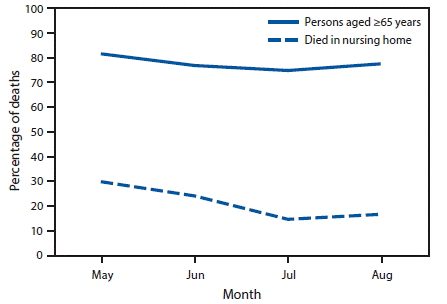
Finally, those who died in the latter half of the year were less likely to be over 65, thereby contributing more years to lost life expectancy. This is likely because after the devastation of long-term care facilities in the first major wave of the pandemic, we learned how to protect residents of these facilities and reduced mortality among them.
Life expectancy redux.
As we near 500,000 lives lost to COVID-19 the scale of the tragedy is hard to fully fathom. And as much as we say that this pandemic was preventable, preventing the next one is as much about learning about who gets hurt and dies when a pandemic hits us as it is about the circumstances that allowed this virus to jump and spread in the first place.
Early in the pandemic, proponents of a “herd immunity” approach argued that we should protect our most vulnerable people while letting the virus run amok among us. That way, the thinking went, we would develop herd immunity through our bodies’ natural immune defense following an infection.
But it also rested on three disastrous assumptions. First, it assumed that our natural immunity would last, which has been proven false by the rapid evolution of strains that are evading natural immunity. Second, it assumed that there weren’t any long-term complications of infection—though upwards of a third of people who are infected report “long haul” symptoms. And finally, it assumed that young people couldn’t get very ill—or even die—of COVID-19. And yet 20% of those who’ve died of COVID-19 hadn’t even hit their 65th birthday.
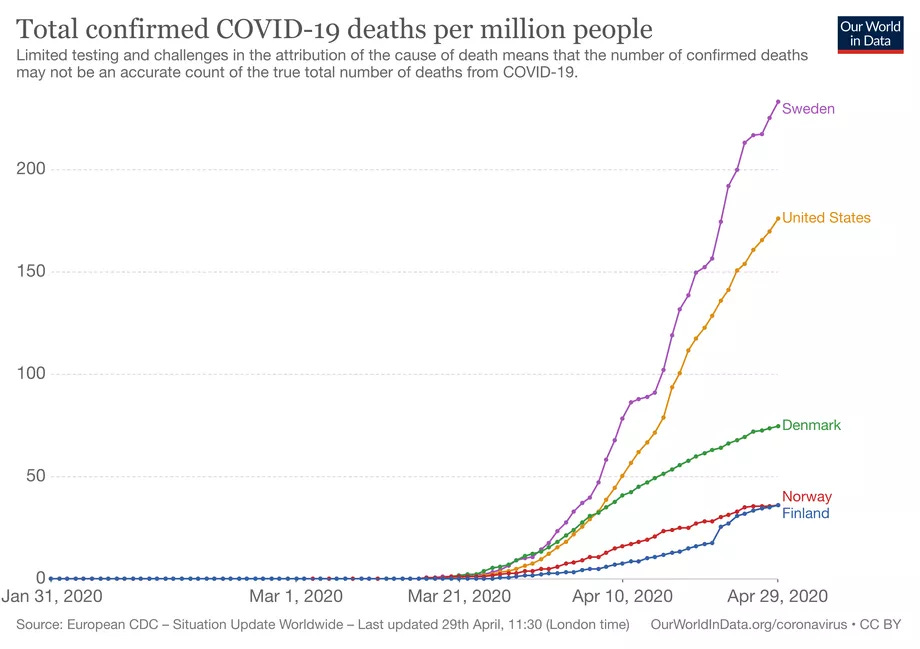
This “herd immunity” approach proved to be disastrous in Sweden, which at one point had one of the world’s highest per capita COVID-19 mortality. But it was always a ruse to justify inaction and provide a pseudo-scientific fig leaf to business interests who wanted to forge ahead despite the consequences. The people who would have suffered would be those who’d suffered the worst burdens of the inequitable economy they would have been sacrificed to save: young Black and brown people.
If we’re serious about learning from this experience, we have to take the full measure of the cost of this pandemic for society—but, in particular, those who we tend to bury deep under the top-lines of our analysis.


Wow, thanks for sharing your public health and epidemiology expertise to help me understand further how Covid has affected all of us.
This is precisely the kind of analysis that makes an impact. Like others, I consume news headlines and sound bytes, and it's rare to understand the full effects of the news being reported without sufficient background and reasoning. Thank you!